I recently wrapped the summer semester of my graduate program, which was a class in Information Design. Although my undergraduate degree included a specialization in editing and graphic design, it had been a while since I had designed at this level and I was happy to receive a refresher and learn new tips and tricks.
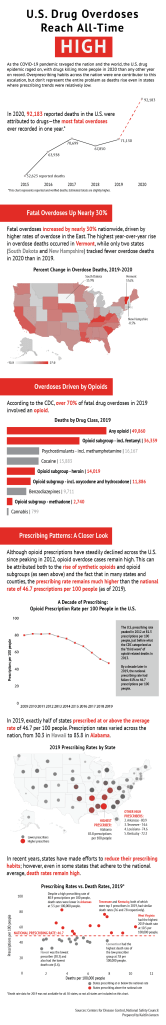
For our final project, we were tasked with creating an infographic that told a story and contained at least four distinct charts. Inspired by a story I heard on NPR about nationwide drug overdoses, I created the following infographic (also linked here – please click on link and click infographic once to enlarge).
I learned a lot from this semester and from this project. I am now much more confident using Adobe Illustrator, and I learned how to create map charts in Google Sheets. I enjoyed this project and am now a much more educated reader of infographics. I look forward to the opportunity to apply these new skills to my future work!
